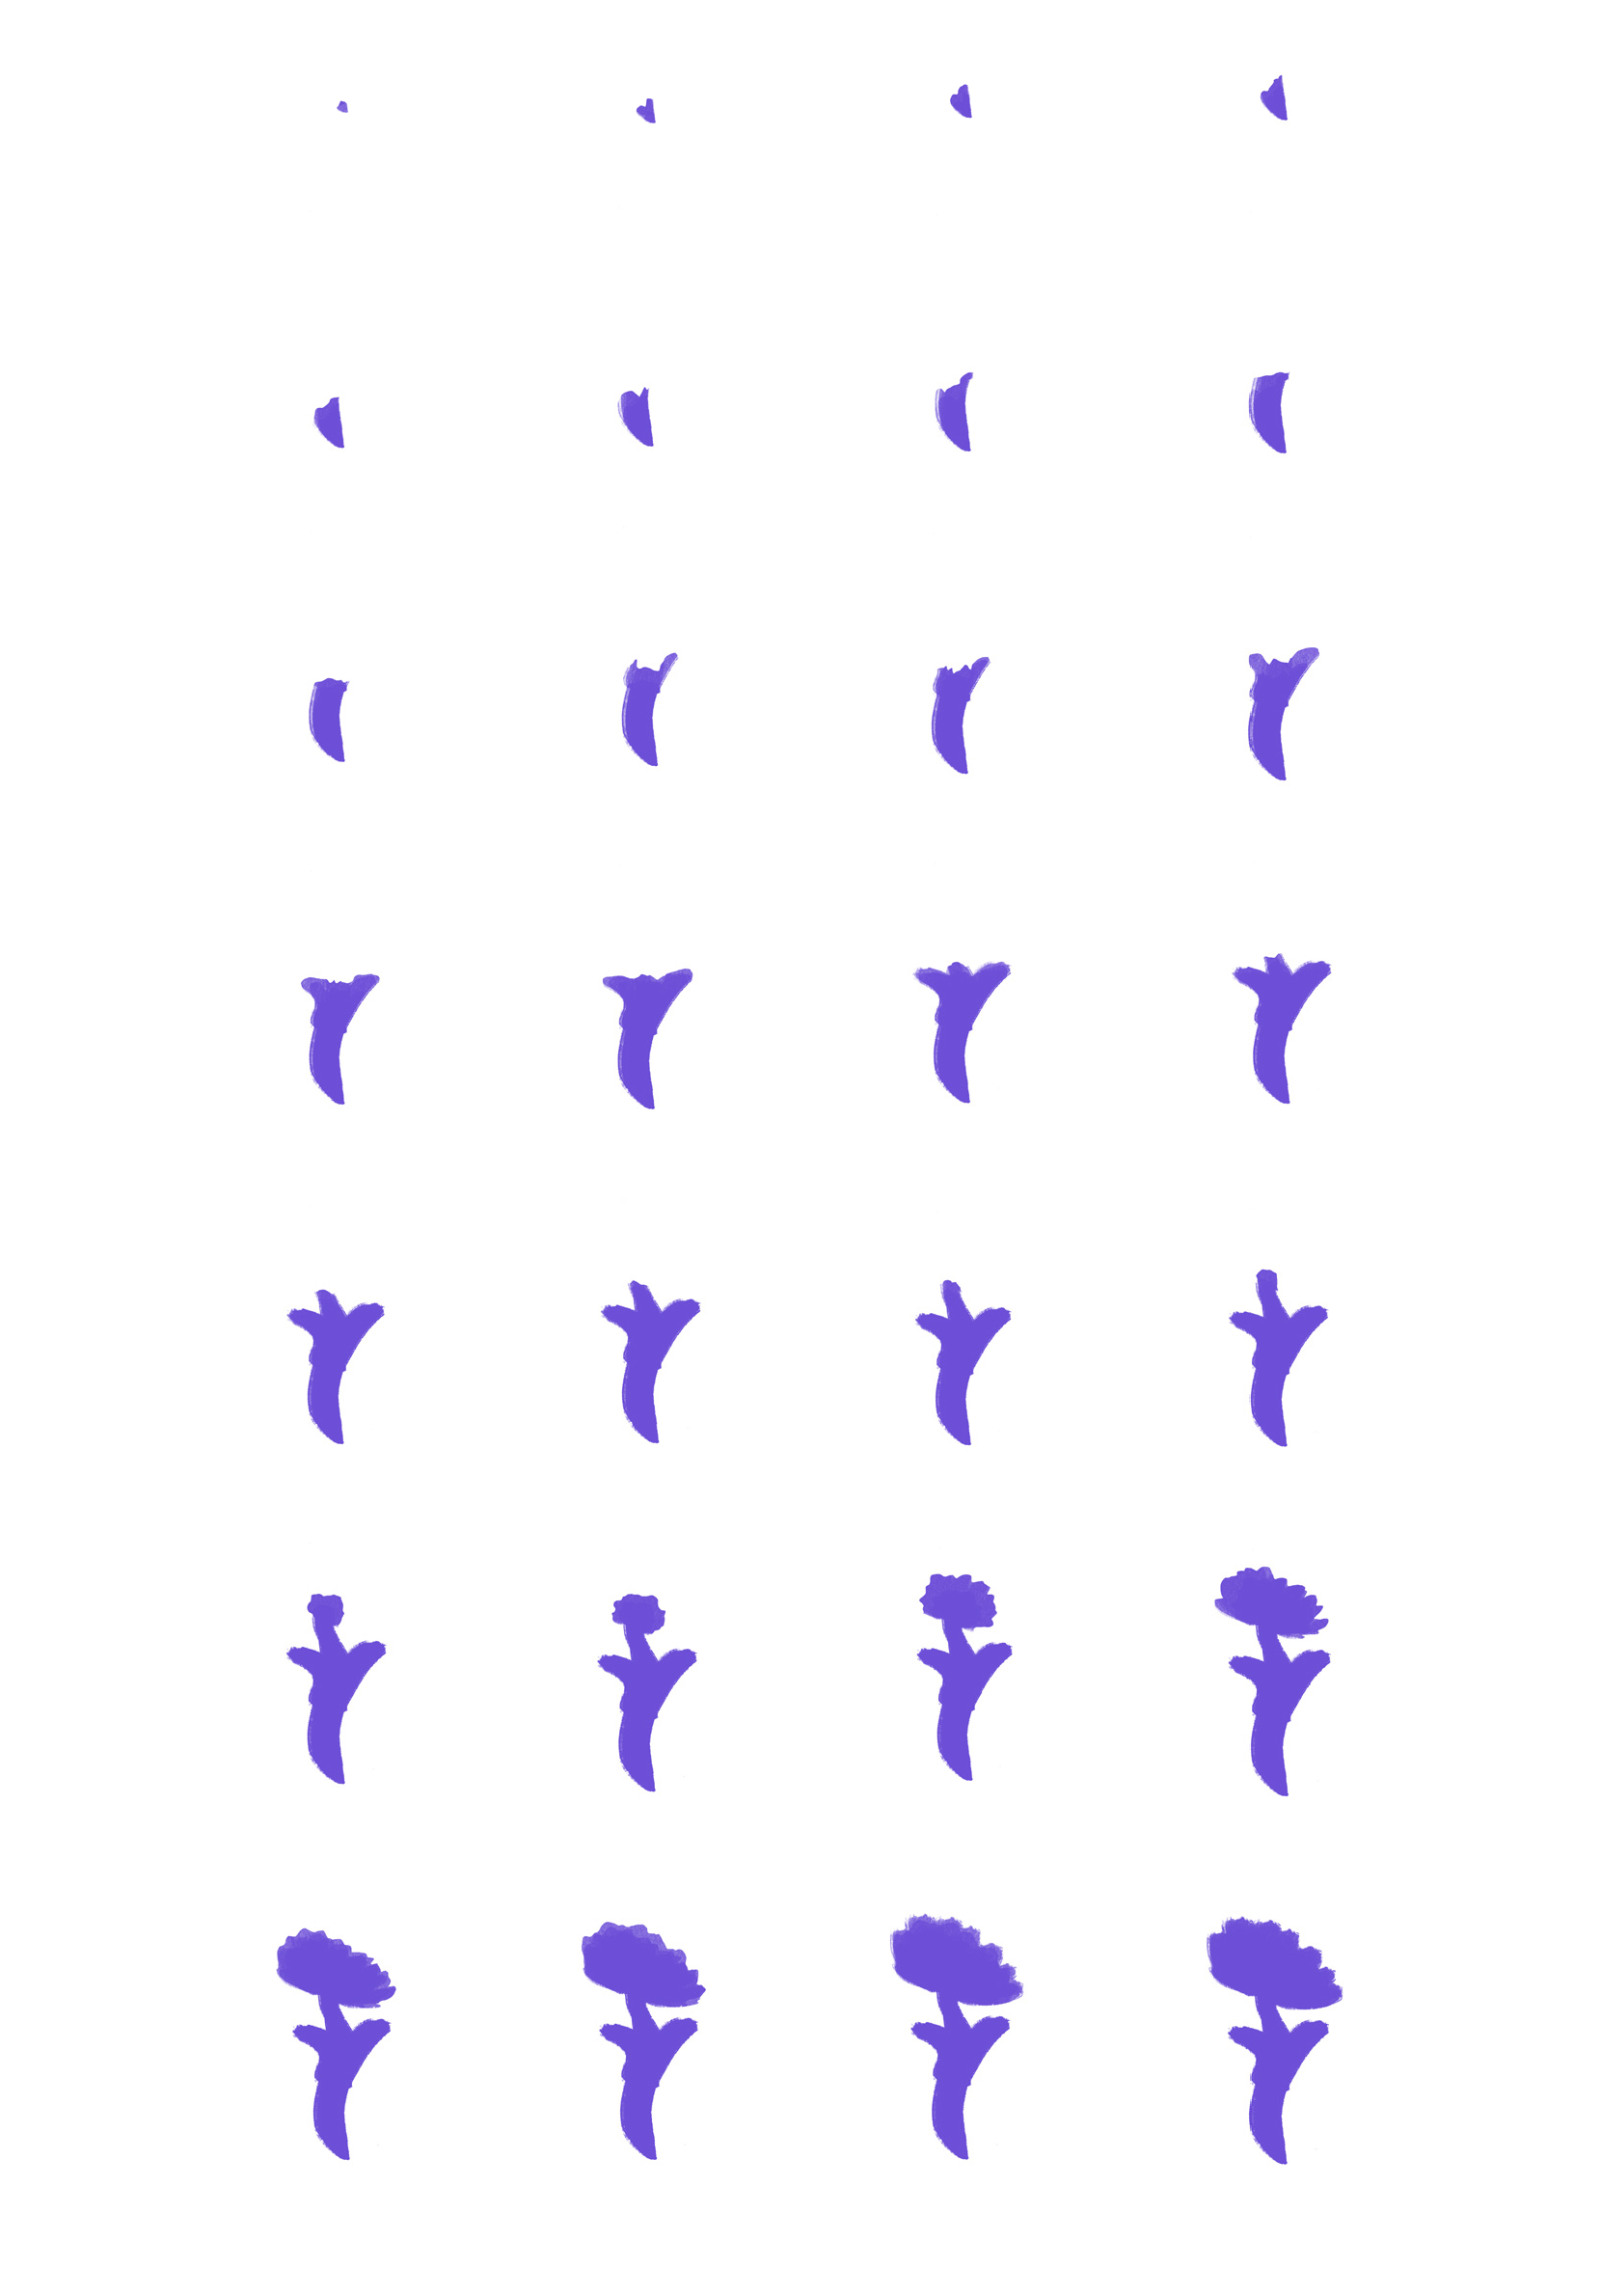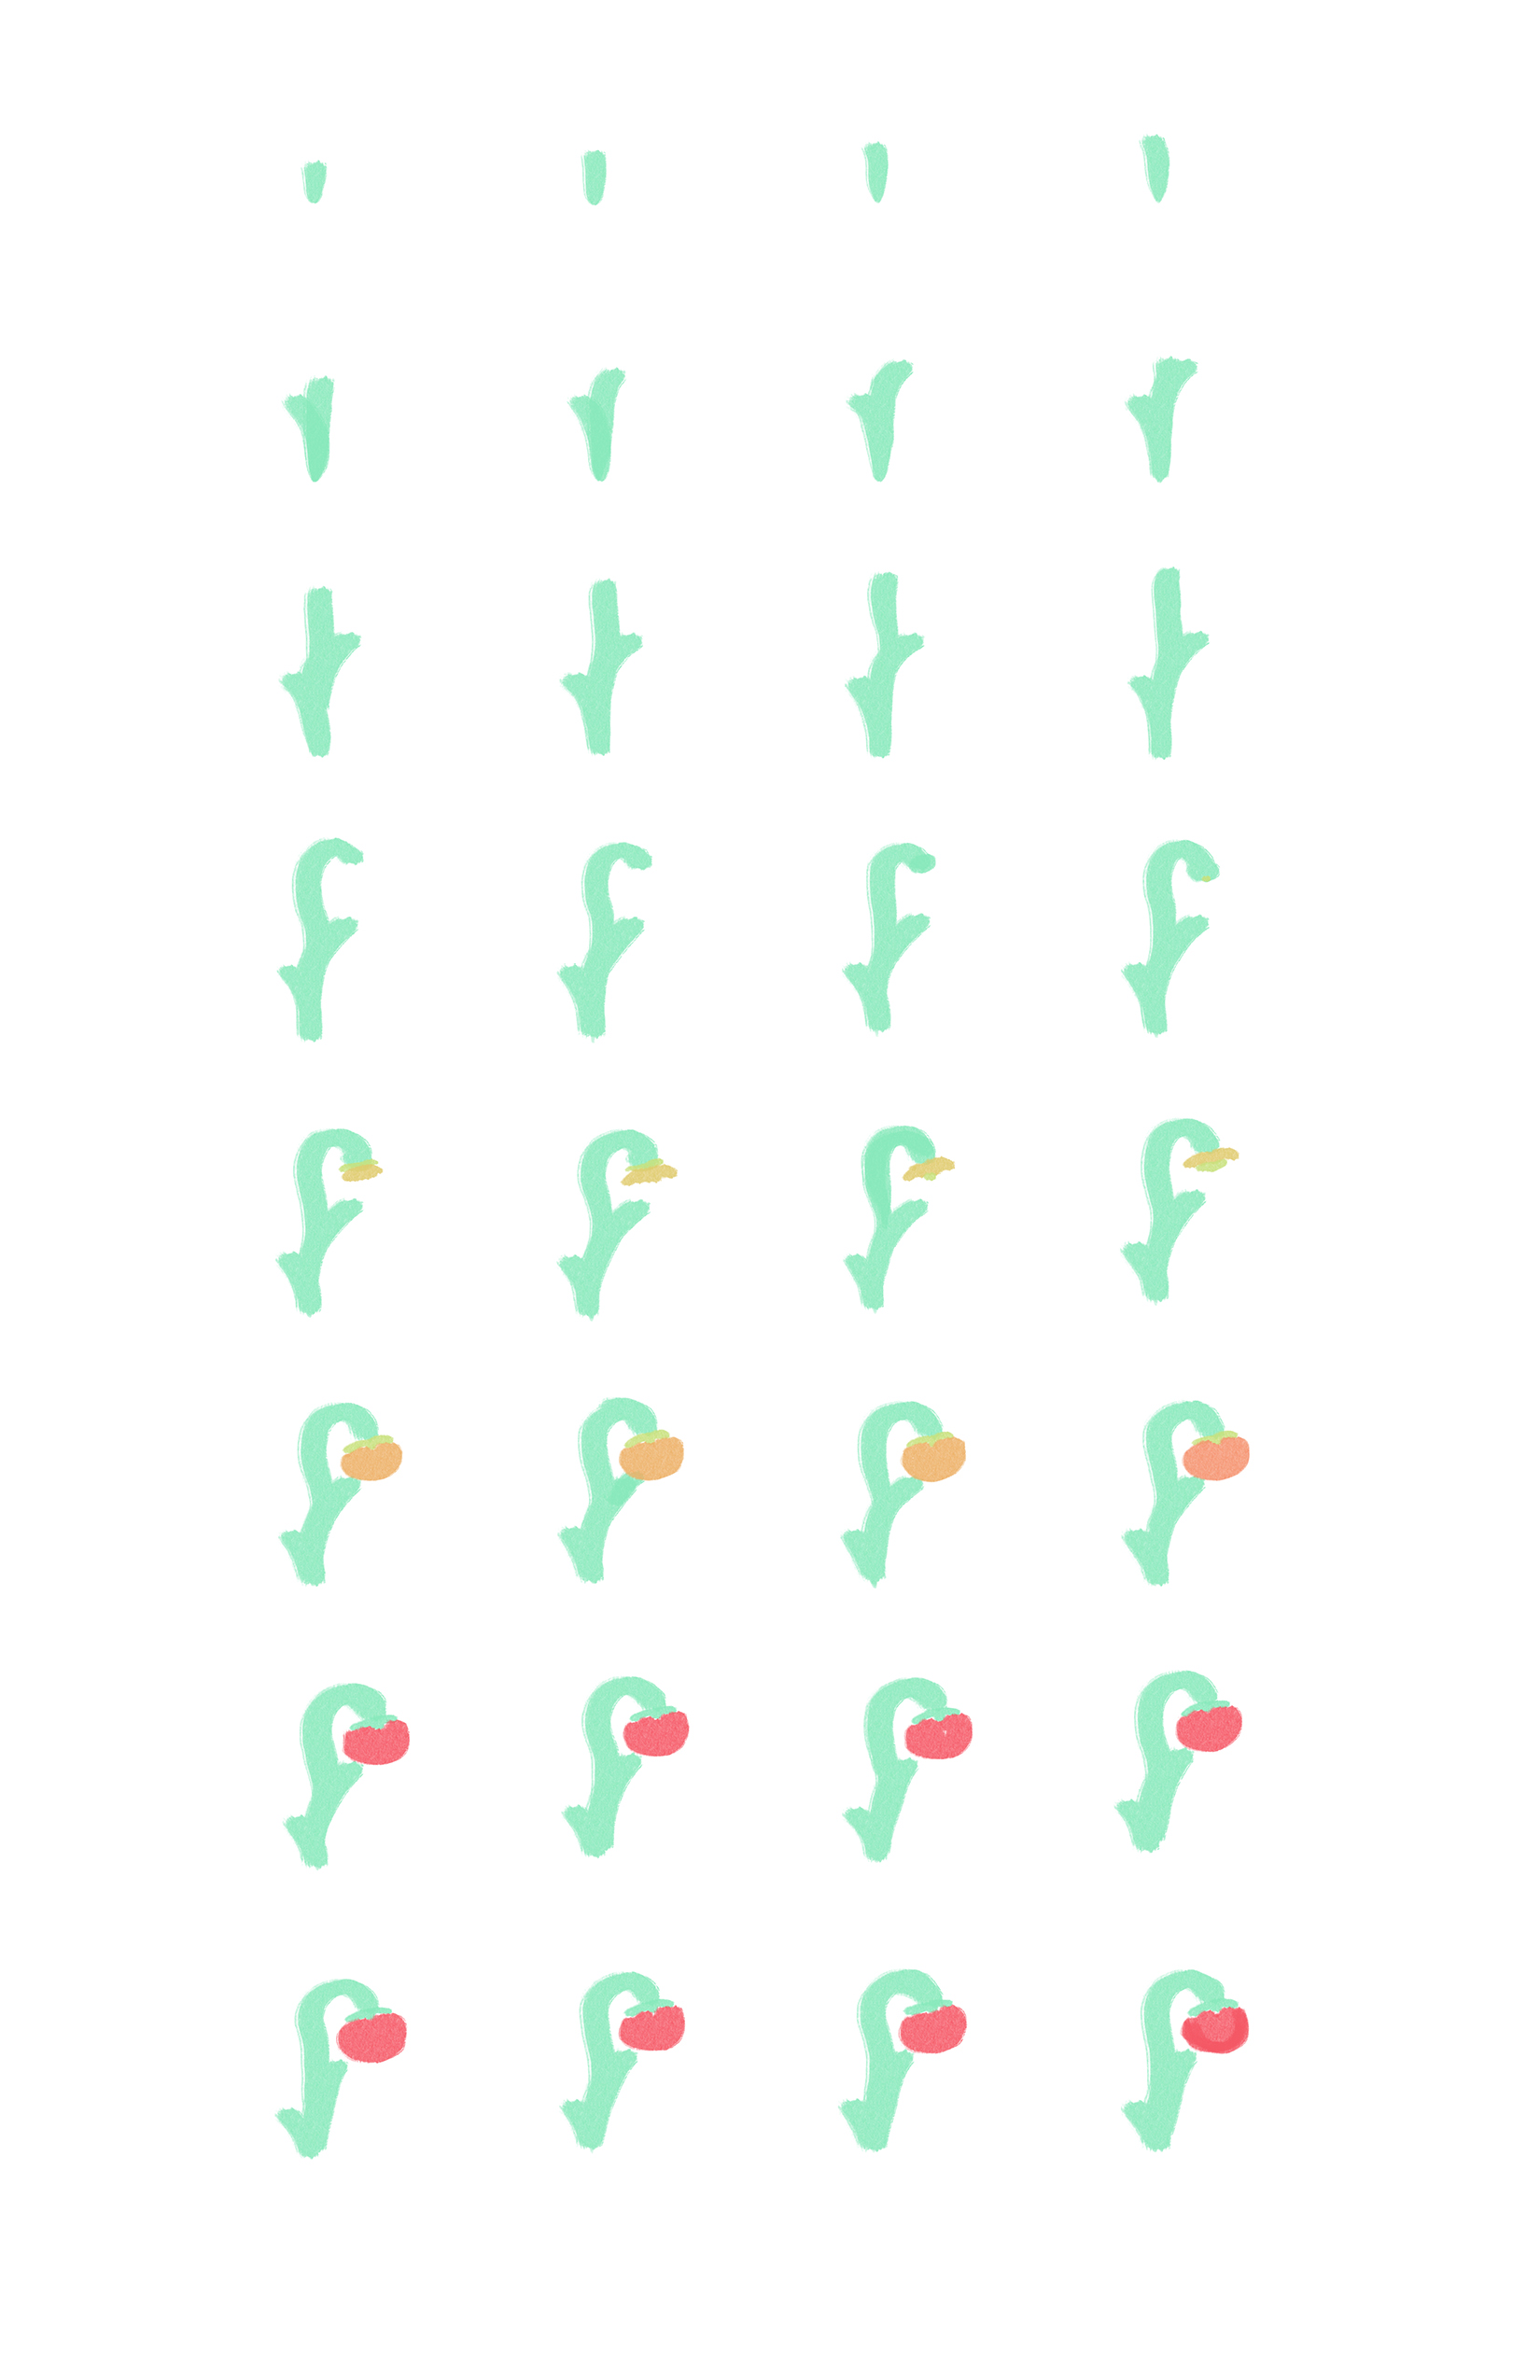
I made these animations to help me brainstorm about how exactly to quantify the user's information within my app. I will likely have plants grow throughout the week to display the user's progress integrating a certain task into their daily routine. Then by the end of the week, if the user has completed a full week of a specific task, they earn either the full plant in their garden or some sort of reward like a badge. Along with this, I would have different sections of the user's garden that collects these weekly achievements over time so that the user can see their progress generating sustainable habits, as well as how often they've been completing them.